November 20, 2023
Stay the Course but Be Willing to Adjust Your Sails
“Go sailing!” they said. “There’s a very beautiful and worthwhile destination just for you over there,” they said. “It’ll be fun!” they said. And for a while, they were right. It was certainly simple enough: you took a basic training course, checked your boat, assembled the mast and the rigging, attached the sails, and loaded your supplies. The wind was at your back, and your destination was directly in front of you. So much for hearing that sailing could be a lot of work. That gourmet sandwich you packed and were planning to have upon arriving at your own special destination is within reach and looks fantastic right now as you dare to relax on the open water. And you think, why not? But suddenly, the wind picks up, and Mother Nature soon lets loose.
Fear sets in and your training goes overboard. But in this moment of discomfort and uncertainty lies a wise metaphor for successful investing. Sailing—just like investing—can demand poise under duress to succeed in making progress against headwinds and ultimately reach your intended destination.
When it comes to investing, market volatility can cause fear so strong that even basic training in the risk-reduction, return-enhancing benefits of diversification is forgotten and one’s strategic asset allocation is completely tossed overboard for the immediate gratification of what seems safe or obvious.
From weight loss to learning and investing to many other areas of human life, immediate gratification often cannibalizes long-term success. And all too often, the bouts of fear brought on by market volatility cause investors to panic and abandon their asset allocations. During times of downside market volatility, investors might shift to asset classes they deem safer, not realizing that they may be significantly limiting their total return growth potential—and may instead be putting themselves at shortfall risk. During times of upside market volatility, investors might rush after asset classes that have outperformed, not realizing that they may be significantly subjecting themselves to excessive risk they had not initially intended. In the short term, either decision can be satisfying, like allowing a new wind to blow you off course instead of remembering your training and adjusting your sails. Often, when wind direction seems unfavorable, you would be better off maintaining your wits and adjusting your sails to reach the desired destination.
Adjusting sails when it comes to evaluating asset allocation amid market volatility can mean—for many—increasing their awareness and understanding of a couple of behavioral biases that tend to plague humanity and, especially, the investing community—namely, self-control bias and representativeness bias. That extra bowl of ice cream is great until your doctor has you step on the scale, an easy-to-understand concept. However, categorizing new information based on past experiences with regard to investing may not be so easy. And that’s why a periodic table of investment returns is both timeless and a part of basic training when it comes to determining asset allocation and understanding the benefit of diversification.
Asset Class Returns
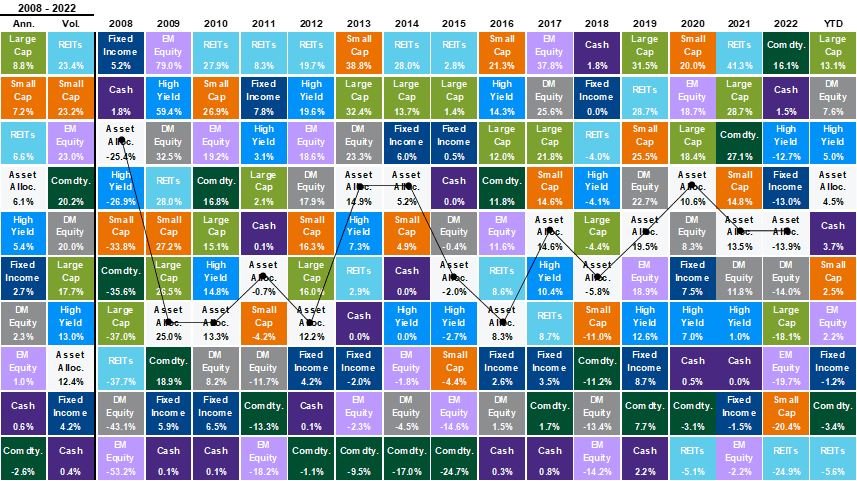
Source: Bloomberg, FactSet, MSCI, NAREIT, Russell, Standard & Poor’s, J.P. Morgan Asset Management.
Large cap: S&P 500, Small cap: Russell 2000, EM Equity: MSCI EME, DM Equity: MSCI EAFE, Comdty: Bloomberg Commodity Index, High Yield: Bloomberg Global HY Index, Fixed Income: Bloomberg US Aggregate, REITs: NAREIT Equity REIT Index, Cash: Bloomberg 1-3m Treasury. The “Asset Allocation” portfolio assumes the following weights: 25% in the S&P 500, 10% in the Russell 2000, 15% in the MSCI EAFE, 5% in the MSCI EME, 25% in the Bloomberg US Aggregate, 5% in the Bloomberg 1-3m Treasury, 5% in the Bloomberg Global High Yield Index, 5% in the Bloomberg Commodity Index and 5% in the NAREIT Equity REIT Index. Balanced portfolio assumes annual rebalancing. Annualized (Ann.) return and volatility (Vol.) represents period from 12/31/2007 to 12/31/2022. All data represents total return for stated period. The “Asset Allocation” portfolio is for illustrative purposes only. Past performance is not indicative of future returns. Guide to the Markets – U.S. Data are as of September 30, 2023.
As you can see, the top-performing asset class of a year ago may not be the top-performing asset class of this year, and predicting the future is virtually impossible. Fear is a powerful motivator, and along with our own self-control bias, can cause even the most well-intentioned investor to forget earlier training and instead chase returns while still knowing deep down that they should not and that doing so can lead to suboptimal results and other unintended consequences.
Over the long term, just missing the best 30 trading days in modern history would have drastic consequences. Also, keep in mind that the best and worst days of the market tend to be very close to each other which makes it that much more challenging to time correctly.
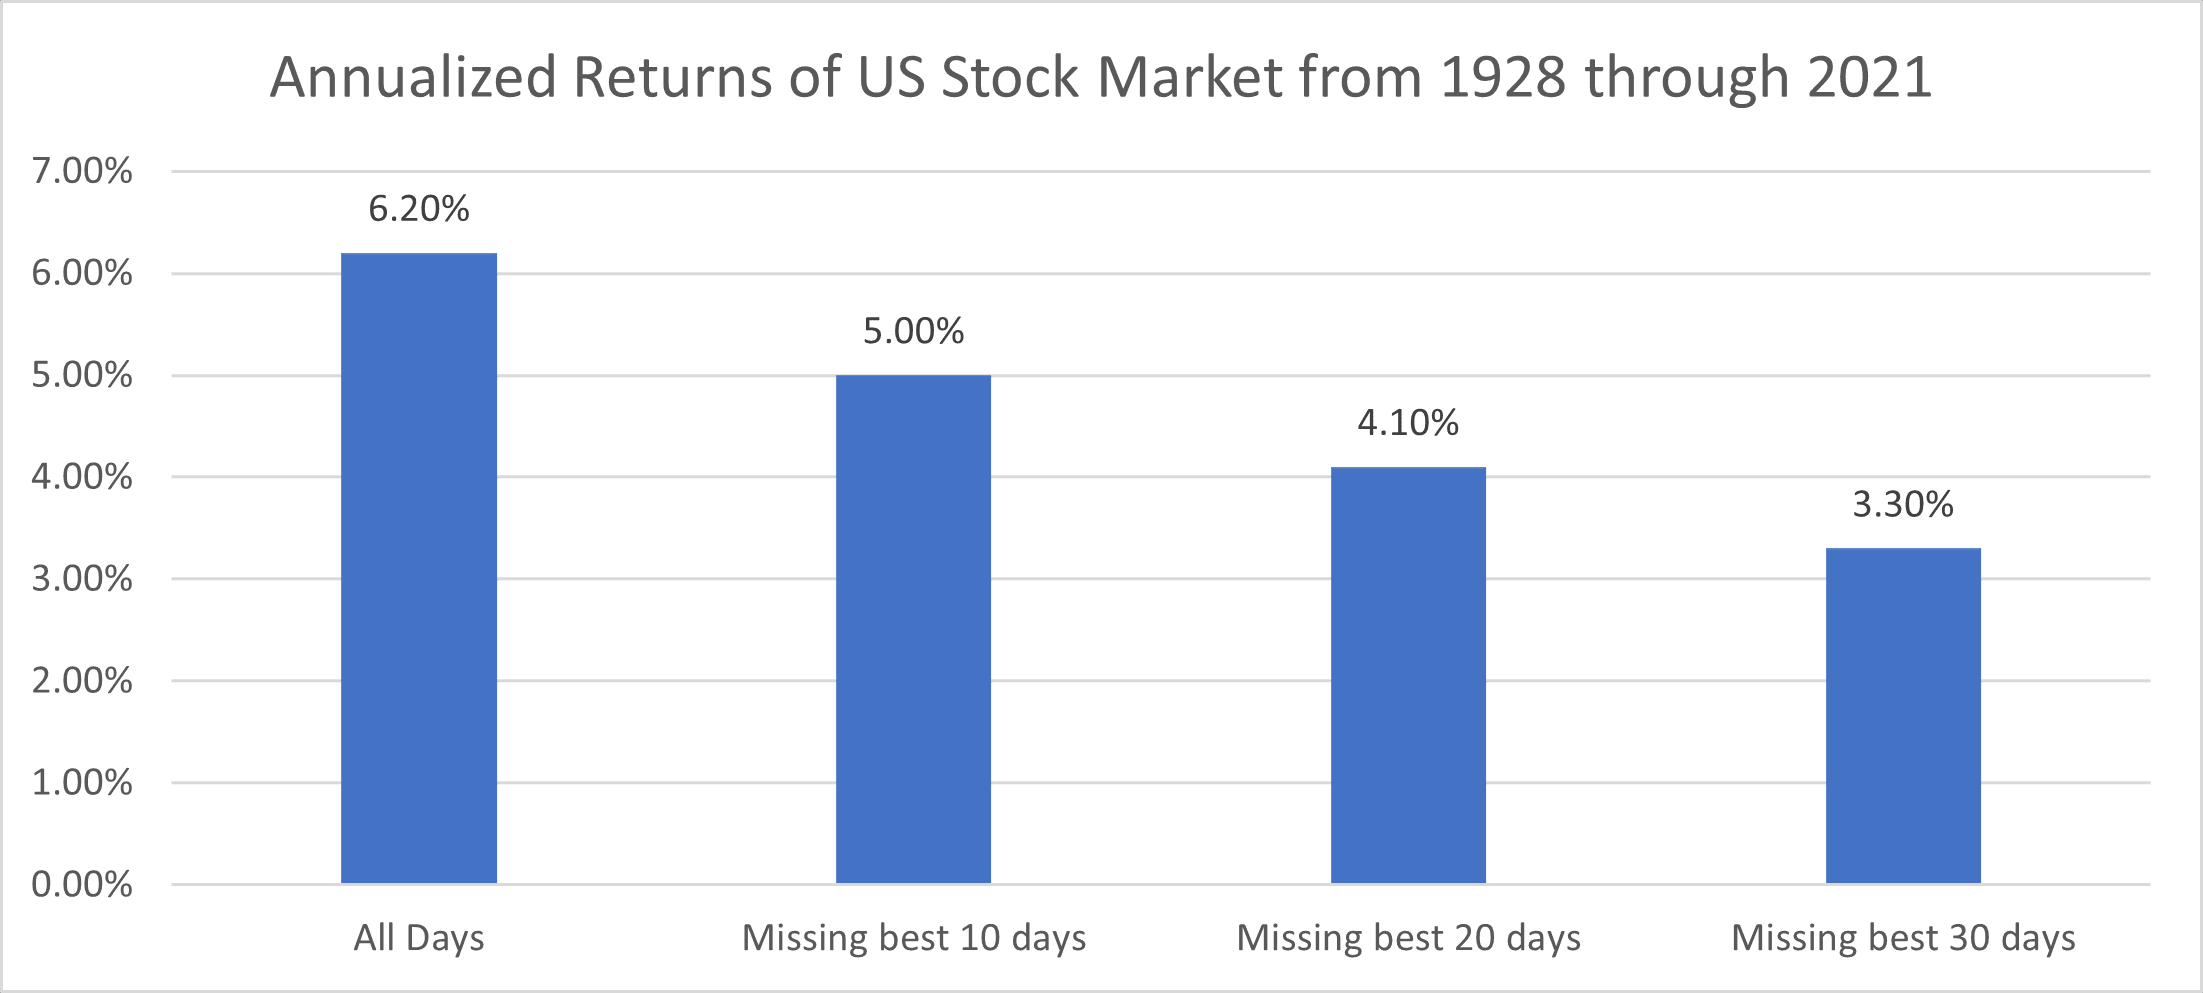
Source: Data from Macrobond, Inc, as of December 31, 2021, as calculated by Vanguard.
Returns are based on the daily price return of the S&P 90 Index from January 1928 through March 1957 and the S&P 500 Index thereafter through 2021 as a proxy for the U.S. stock market. The returns do not include reinvested dividends.
So, how do we overcome our own human nature? The first step is to know that these and many more behavior biases exist that blow us in the opposite direction of rational thought. Virtually no one is immune to them. And, like a lot of things in life, the key to success is self-discipline. When it comes to your asset allocation amid market volatility, don’t allow biases to dictate your actions. Stay the course. Your Fulcrum advisor is here to provide guidance and help you navigate rough seas. Please reach out to your team any time you have questions about your portfolio, the markets, or the impact of market volatility on your long-term plans.
Unless otherwise noted, data presented in this report is from recognized financial and statistical reporting services or similar sources including but not limited to Reuters, Bloomberg, the Bureau of Labor Statistics, or the Federal Reserve. While the information above is obtained from reliable sources, we do not guarantee its accuracy. This report is limited to the dissemination of general information pertaining to Fulcrum Capital, LLC, including information about our advisory services, investment philosophy, and general economic and market conditions. This communication contains information that is not suitable for everyone and should not be construed as personalized investment advice. Past results are not an indication of future performance. This report is not intended to be either an expressed or implied guarantee of actual performance, and there is no guarantee that the views and opinions expressed above will come to pass. It is not intended to supply tax or legal advice, and there is no solicitation to buy or sell securities or engage in a particular investment strategy. Individual client needs, allocations, and investment strategies differ based on a variety of factors. Any reference to a market index is included for illustrative purposes only, as it is not possible to directly invest in an index. Indices are unmanaged, hypothetical vehicles that serve as market indicators. Index performance does not include the deduction of fees or transaction costs which otherwise reduce performance of an actual portfolio. This information is subject to change without notice. Fulcrum Capital, LLC is an SEC registered investment adviser with its principal place of business in the state of Washington. For additional information about Fulcrum Capital please request our disclosure brochure using the contact information below.
