May 20, 2024
Decision 2024:
History Often Rhymes
In numerology, the number 47 signifies stability and harmony. As we embark on an election year in 2024, such tranquility seems out of reach in the run-up to the election of the 47th president of the United States. For the next six months, investors will be inundated with opinions and predictions about the impact of the election on policies and markets. It’s tempting to react to the constant stream of what may seem like new information, but we expect patience and a long-term view will be rewarded. Financial markets tend to calm down once the electoral dust settles, regardless of the victor.
Indeed, history demonstrates that the impact of elections on markets is short-lived. But that does not mean investors should not bother thinking about and preparing for the outcome. In that vein, we are publishing a two-part series. In this first piece, we study the impact of elections on the stock market and explore how political affiliation impacts investor sentiment. In part two, to be published later this summer, we will explore investment strategies that are oriented for success under the likely policies of either candidate.
To kick off our first piece, let’s look at historic election cycles and the S&P 500 Index. Several patterns emerge:
- Stocks are more volatile than average during election years. During election years, the stock market typically suffers a decline of about 17% before Memorial Day and recovers in late summer as a likely winner emerges. In non-election years, the typical sell-off is 13% and comes after May.[1]
- Stocks don’t necessarily do worse during election years. Full-year returns are about the same (7.5%) as in non-election years (8.0%).[2] The best returns tend to come during the pre-election year, and the worst returns come during the second year of the president’s term.
- Stocks tend to rally when an incumbent runs for re-election, likely because incumbents extend favorable policies on taxes and spending.
- Elections impact sectors differently. According to Ned Davis Research, high-beta and cyclical stocks tend to outperform defensive sectors during election years, while stocks in industries facing regulatory risk tend to underperform.[3]
- The stock market is a leading indicator of the election outcome. Historically, if the S&P 500 is higher in the three months before the election, the incumbent party wins, and if stocks are lower in the three-month period, the opposition party has won. This has been true in every presidential election since 1984 except one (2020), and 83% of the time since 1928. [4]
While election year patterns can be observed, there doesn’t seem to be a consistent pattern in stock market performance under different political regimes. On average, the stock market has risen at a faster rate when Republicans have controlled both Congress and the White House. However, the sample size is so small as to be inconclusive, with only eight instances post World War II. The Democrats controlled both the House and Congress nearly three times as often, and during those years, both stock returns and GDP growth were above average. Even during periods of a divided government, markets gained 7.9% on average and the strongest returns were experienced under a Democratic President, Republican controlled House and a Democratic led senate.[5]
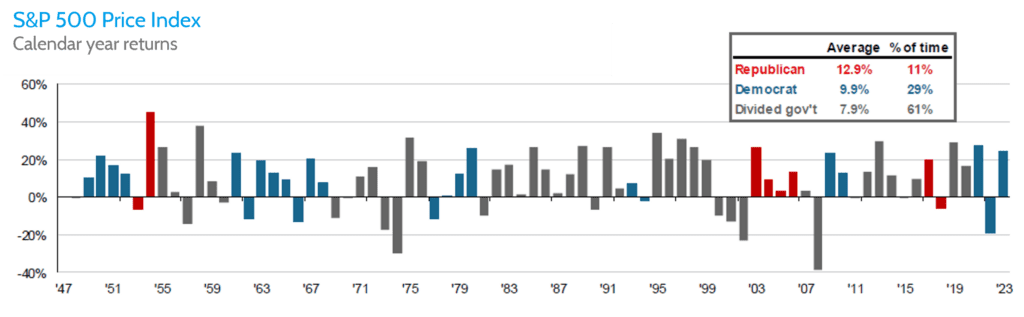
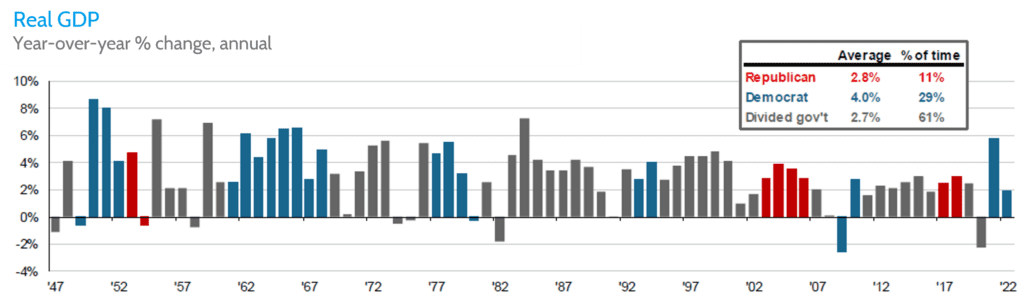
Source: BEA, Standard & Poor’s, FactSet, J.P. Morgan Asset Management. Data is calendar year. Data as of December 31, 2023.
This doesn’t stop investors from applying a partisan lens. Studies show that Democrats and Republicans’ opinions diverge around the direction of the economy at any given time, and this likely influences their investment decisions. The chart below shows that both Democrats and Republicans are more optimistic about the economy when the president is from their own party. Even now amidst Biden’s first term presidency, Republicans on average expect 2.4% higher inflation in the year ahead than Democrats.[6]
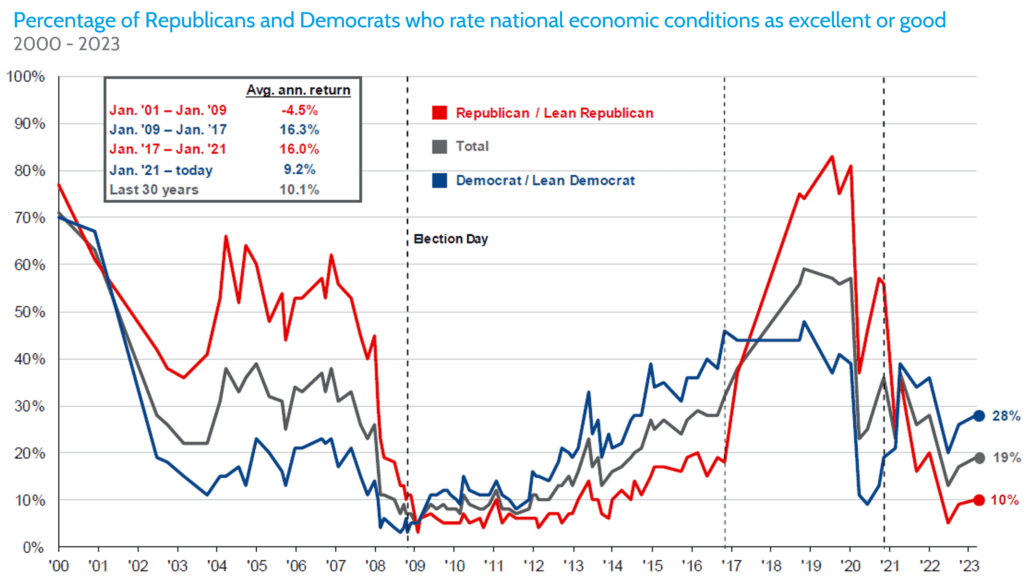
Source: Pew Research Center, J.P. Morgan Asset Management. Pew Research Center, “Republicans, Democrats Move Even Further Apart in Coronavirus Concerns.” Question: Thinking about the nation’s economy, How would you rate economic conditions in this country today…as excellent, good, only fair, poor? This survey was last conducted in March 2023. Data as of December 31, 2023.
Pattern recognition is an important part of investing. Although history rarely repeats itself perfectly, it often rhymes. We can make better investment decisions when we understand history and how our biases shape our outlook. These trends are generally less about presidential elections and more about near-term uncertainty and the volatility this creates in markets. As we move through this election year, we expect this uncertainty will dissipate as the election approaches, and investor focus will shift to preparing for the longer-term effects of regulation, taxes, spending, and other policies.
Our message is not that the election of our 47th President doesn’t matter for investors. It does, and while we can’t predict the outcome, we can and should prepare for various election scenarios. In part two of this series, we will explore how investors can prepare for the expected policies of the two presidential candidates.
[1] Average annual intra-year peak-to-trough drawdown for the S&P 500 Index between 1928 – 2023. Source: J.P. Morgan Asset Management
[2] Average annual total return for the S&P 500 Index between 1928 – 2023. Source: J.P. Morgan Asset Management
[3] Ned Davis Research (NDR), 2020 Election Handbook, July 14, 2020
[4] Strategas, 2020 Election Chartbook, September 9, 2020
[5] Strategas, Partisan Control Average Performance (1933 to 2023, Excluding 2001-2002)
[6] The Economist, April 21, 2024
Unless otherwise noted, data presented in this report is from recognized financial and statistical reporting services or similar sources including but not limited to Reuters, Bloomberg, the Bureau of Labor Statistics, or the Federal Reserve. While the information above is obtained from reliable sources, we do not guarantee its accuracy. This report is limited to the dissemination of general information pertaining to Fulcrum Capital, LLC, including information about our advisory services, investment philosophy, and general economic and market conditions. This communication contains information that is not suitable for everyone and should not be construed as personalized investment advice. Past results are not an indication of future performance. This report is not intended to be either an expressed or implied guarantee of actual performance, and there is no guarantee that the views and opinions expressed above will come to pass. It is not intended to supply tax or legal advice, and there is no solicitation to buy or sell securities or engage in a particular investment strategy. Individual client needs, allocations, and investment strategies differ based on a variety of factors. Any reference to a market index is included for illustrative purposes only, as it is not possible to directly invest in an index. Indices are unmanaged, hypothetical vehicles that serve as market indicators. Index performance does not include the deduction of fees or transaction costs which otherwise reduce performance of an actual portfolio. This information is subject to change without notice. Fulcrum Capital, LLC is an SEC registered investment adviser with its principal place of business in the state of Washington. For additional information about Fulcrum Capital please request our disclosure brochure using the contact information below.
